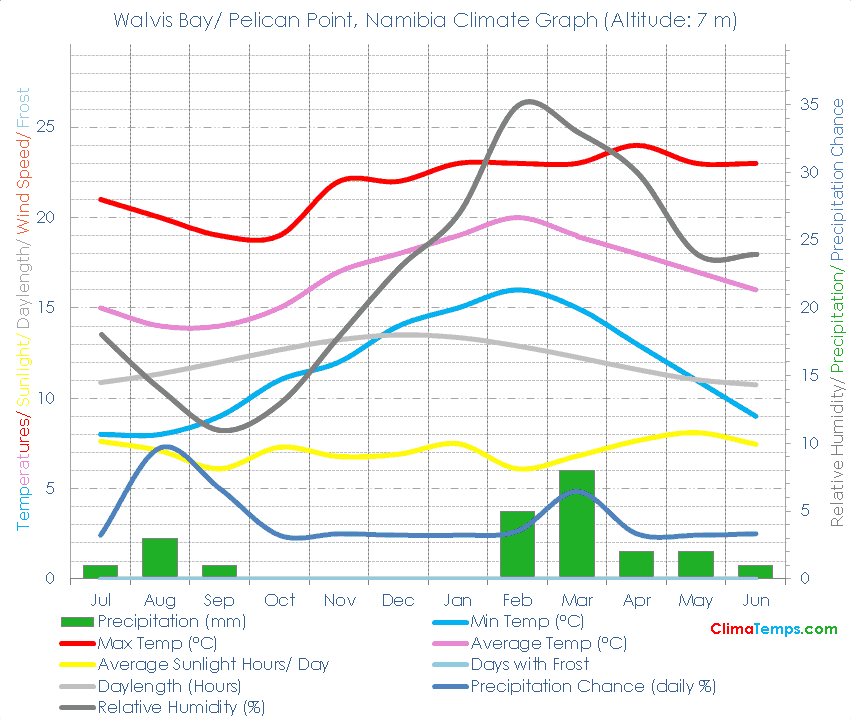
🌡️ The mean temperature is 16.8 degrees Celsius (62.3 degrees Fahrenheit). See the temperatures page for a monthly breakdown and the fixed scale graph.
🐬 Average monthly temperatures vary by 6 °C (10.8°F). This indicates that the continentality type is hyperoceanic, subtype truly hyperoceanic.
☔ Total annual precipitation averages 23 mm (0.9 inches) which is equivalent to 23 Litres/m² (0.56 Gallons/ft²).
Simply paste the following HTML code into your webpage. Please include a link back to this website. There is one in the following code already. Edit the width attribute to change the size of the graph if needed:
✨ The longest day of the year is 13:24 long on the 21 of December and the shortest day is 10:35 long on the 22 of June.
🌞 On average there are 2646 hours of sunshine per year. Visit the sunshine and daylight section to check monthly details including how high in the sky the sun reaches each month.
🐇Were you to burrow down through the centre of the Earth from Walvis Bay/ Pelican Point you would pop up nearest to the climate station at Lihue, Kauai, Hawaii where you would find a Tropical wet and dry/ savanna climate.
🌍Walvis Bay/ Pelican Point, Namibia is at 22°52'S, 14°25'E, 7 m (23 ft). Check the location on the map.
| Climate Variable | Jul | Aug | Sep | Oct | Nov | Dec | Jan | Feb | Mar | Apr | May | Jun | Annual | ||
|---|---|---|---|---|---|---|---|---|---|---|---|---|---|---|---|
| Average Max Temperature °C ( °F) | 21 (70) | 20 (68) | 19 (66) | 19 (66) | 22 (72) | 22 (72) | 23 (73) | 23 (73) | 23 (73) | 24 (75) | 23 (73) | 23 (73) | 22 (71) | ||
| Average Temperature °C ( °F) | 15 (59) | 14 (57) | 14 (57) | 15 (59) | 17 (63) | 18 (64) | 19 (66) | 20 (68) | 19 (66) | 18 (64) | 17 (63) | 16 (61) | 17 (62) | ||
| Average Min Temperature °C ( °F) | 8 (46) | 8 (46) | 9 (48) | 11 (52) | 12 (54) | 14 (57) | 15 (59) | 16 (61) | 15 (59) | 13 (55) | 11 (52) | 9 (48) | 12 (53) | ||
| Average Precipitation mm (in) | 1 (0) | 3 (0) | 1 (0) | 0 (0) | 0 (0) | 0 (0) | 0 (0) | 5 (0) | 8 (0) | 2 (0) | 2 (0) | 1 (0) | 23 (1) | ||
| Number of Wet Days (probability of rain on a day %) | 1 (3) | 3 (10) | 2 (7) | 1 (3) | 1 (3) | 1 (3) | 1 (3) | 1 (4) | 2 (6) | 1 (3) | 1 (3) | 1 (3) | 16 (4) | ||
| Average Sunlight Hours/ Day | 7h 36' | 7h 05' | 6h 18' | 7h 17' | 7h 00' | 6h 54' | 7h 29' | 6h 41' | 6h 48' | 7h 54' | 8h 05' | 7h 42' | 7h 14' | ||
| Average Daylight Hours/ Day | 10h 52' | 11h 21' | 12h 00' | 12h 40' | 13h 14' | 13h 30' | 13h 21' | 12h 53' | 12h 16' | 11h 35' | 11h 01' | 10h 44' | 12h 00' | ||
| Percentage of Sunny (Cloudy) Daylight Hours | 71 (29) | 63 (37) | 53 (47) | 58 (42) | 53 (47) | 52 (48) | 57 (43) | 52 (48) | 56 (44) | 69 (31) | 74 (26) | 73 (27) | 60 (40) | ||
| Sun altitude at solar noon on the 21st day (°). | 46.7 | 55.1 | 66.4 | 77.3 | 85.6 | 89.3 | 86 | 77.2 | 66.8 | 55.2 | 46.9 | 43.7 | 66.4 |
Please take a moment to share a climate graph or simply the address:
Thank You, so much! ❤️